
Deliver Personalized Marketing Experiences
Transform insights from your customers into marketing experiences that fuel growth. We believe that in order to deliver personalized experiences to your customers, you must be able to activate your customer, campaign and catalog data from one central and organized hub.

Paid Social
Acquire new customers and boost brand recognition with engaging ads and retargeting, enhanced by custom lists from Pond.

Paid Search
We show the right product to the right customer at the precise moment they intend to make a purchase. Whether it's bidding strategies, ad extensions, or keyword optimization, we drive conversions and maximize ROI.

SEO
Dominate search results, increase market share, and diversify your marketing efforts with SEO through meticulous keyword research and optimization.

CRO
Optimize landing pages through rigorous testing to convert clicks into sales, while enhancing user experiences. Our data-driven approach drives consistent growth.
Boost sales, retention, and CLV with strategic email marketing. Engage new customers and nurture existing ones for long-term owned-channel success.
SMS
Deliver exclusive offers and create a VIP experience with our SMS marketing. Engage new customers, retain existing ones, and boost Customer Lifetime Value (CLV).

Loyalty
Provide exclusive rewards and personalized experiences, tailoring incentives that keep customers coming back for more. We're not just retaining customers; we're creating brand advocates who spread the word and drive sustained growth for your ecommerce business.

Reviews
Cultivate a strong online reputation with positive customer feedback, boosting brand credibility and ecommerce success.

Programmatic
Maximize brand visibility. Display, native, and video ads create top-of-funnel awareness and reinforce it through retargeting.

Amazon
Unlock growth potential by optimizing Amazon listings and leveraging Amazon Advertising.
How We Work
A Clear Roadmap to Success
We execute a strategy customized for your unique business. We take action, measure results, learn, and adjust. It's our job to help you reach your goals.
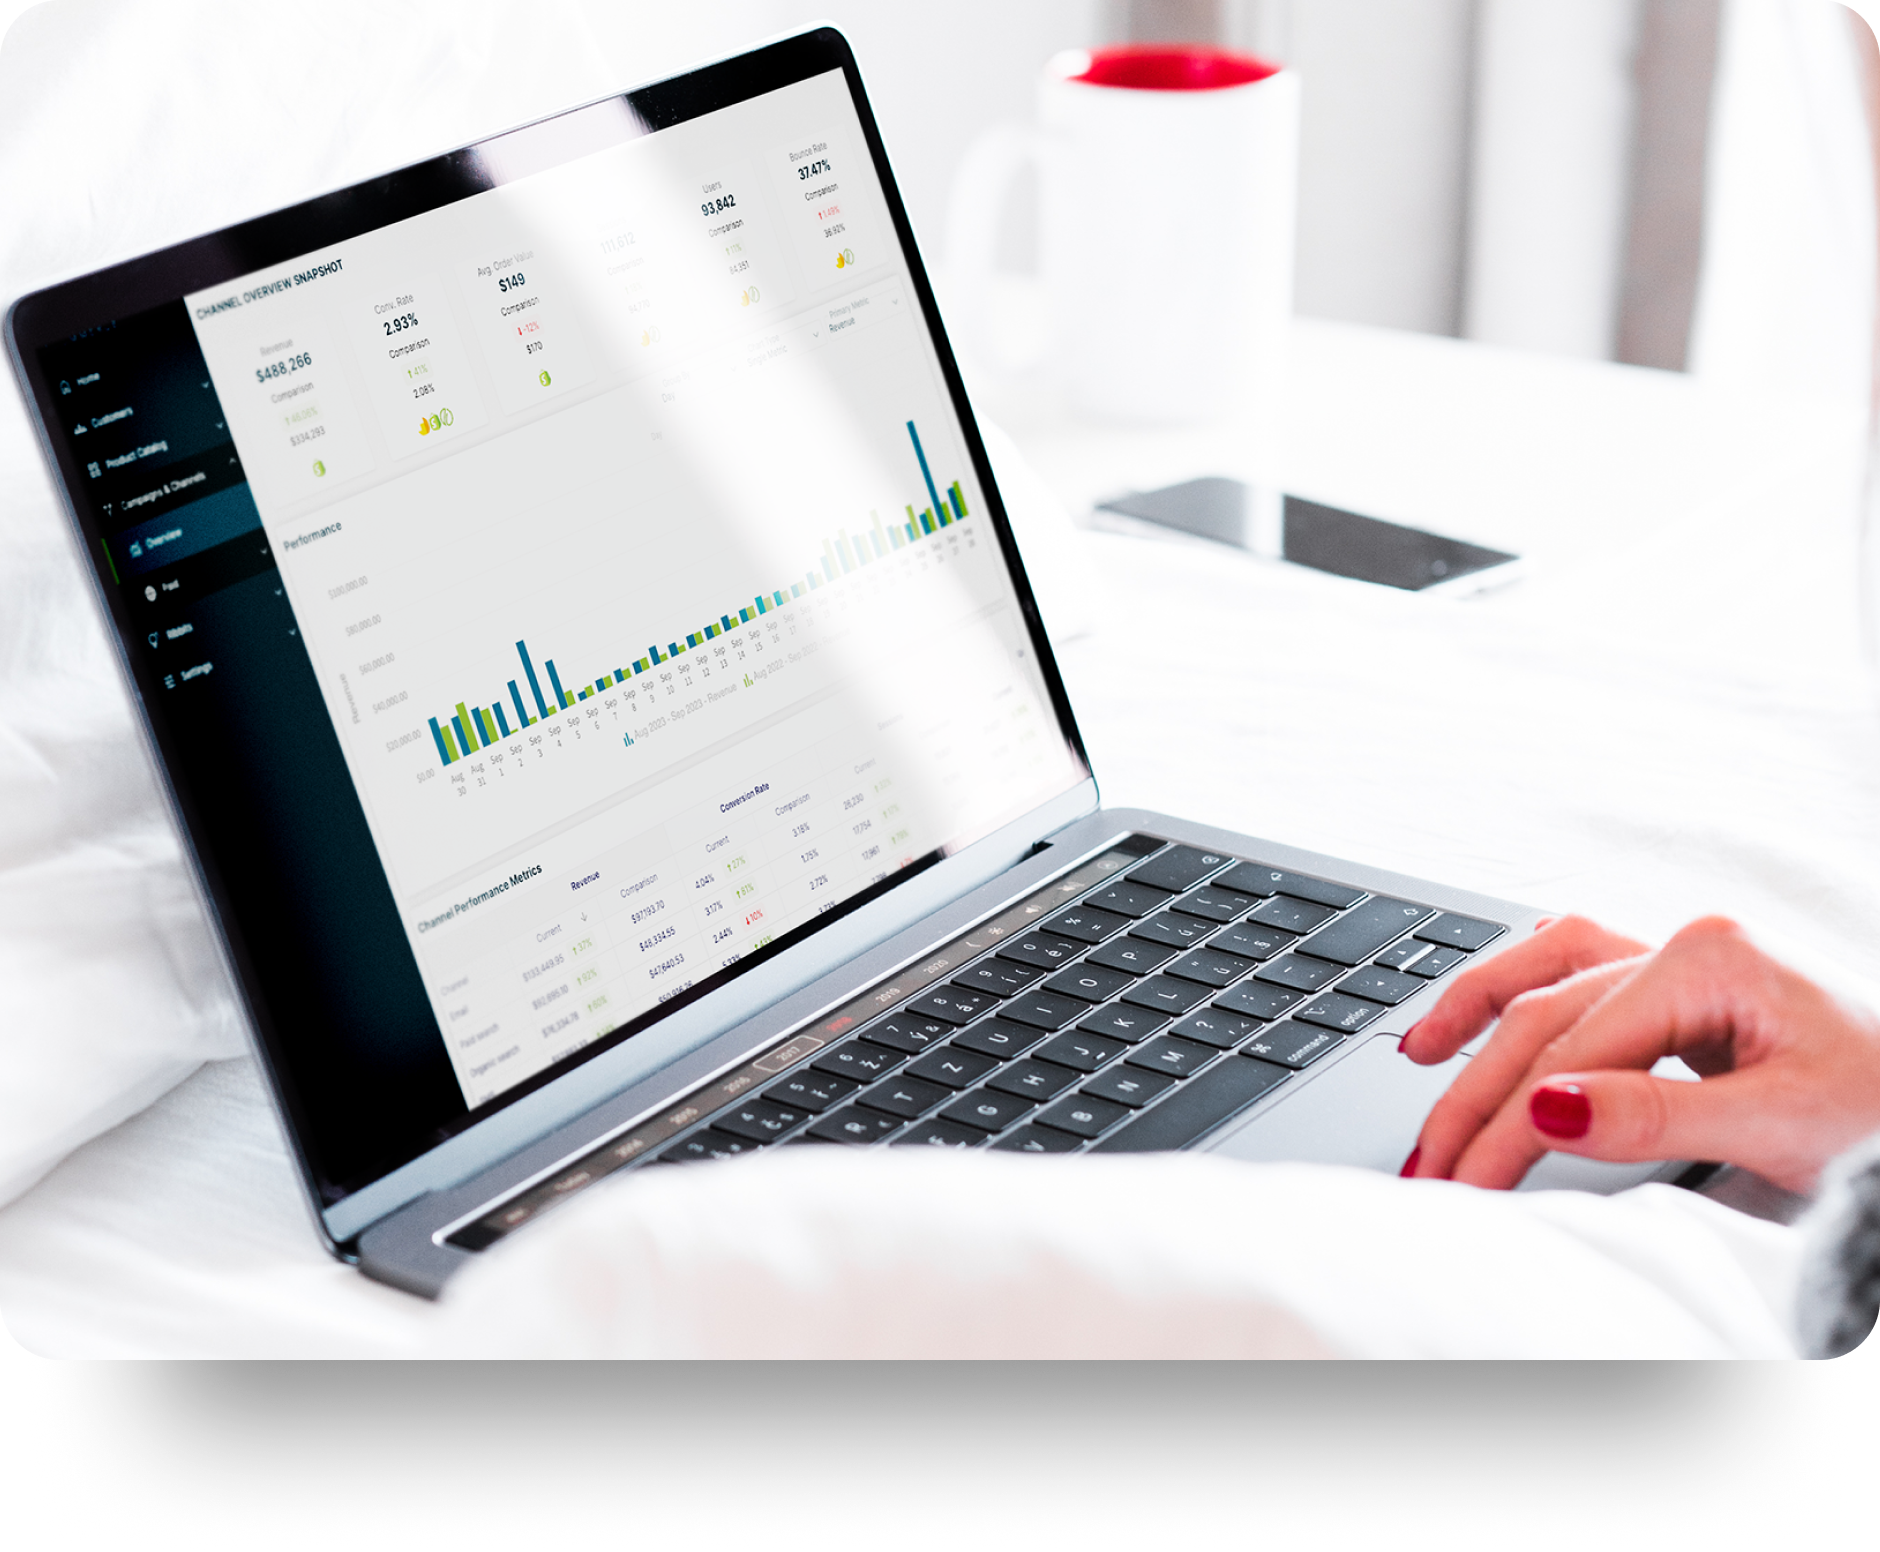
Precise Execution
Drowning in "data noise?" We filter through it and turn down the volume. We become well versed in your customer, catalog and ad campaign data and hone in on exactly where to focus energy.
Increase Customer Lifetime Value
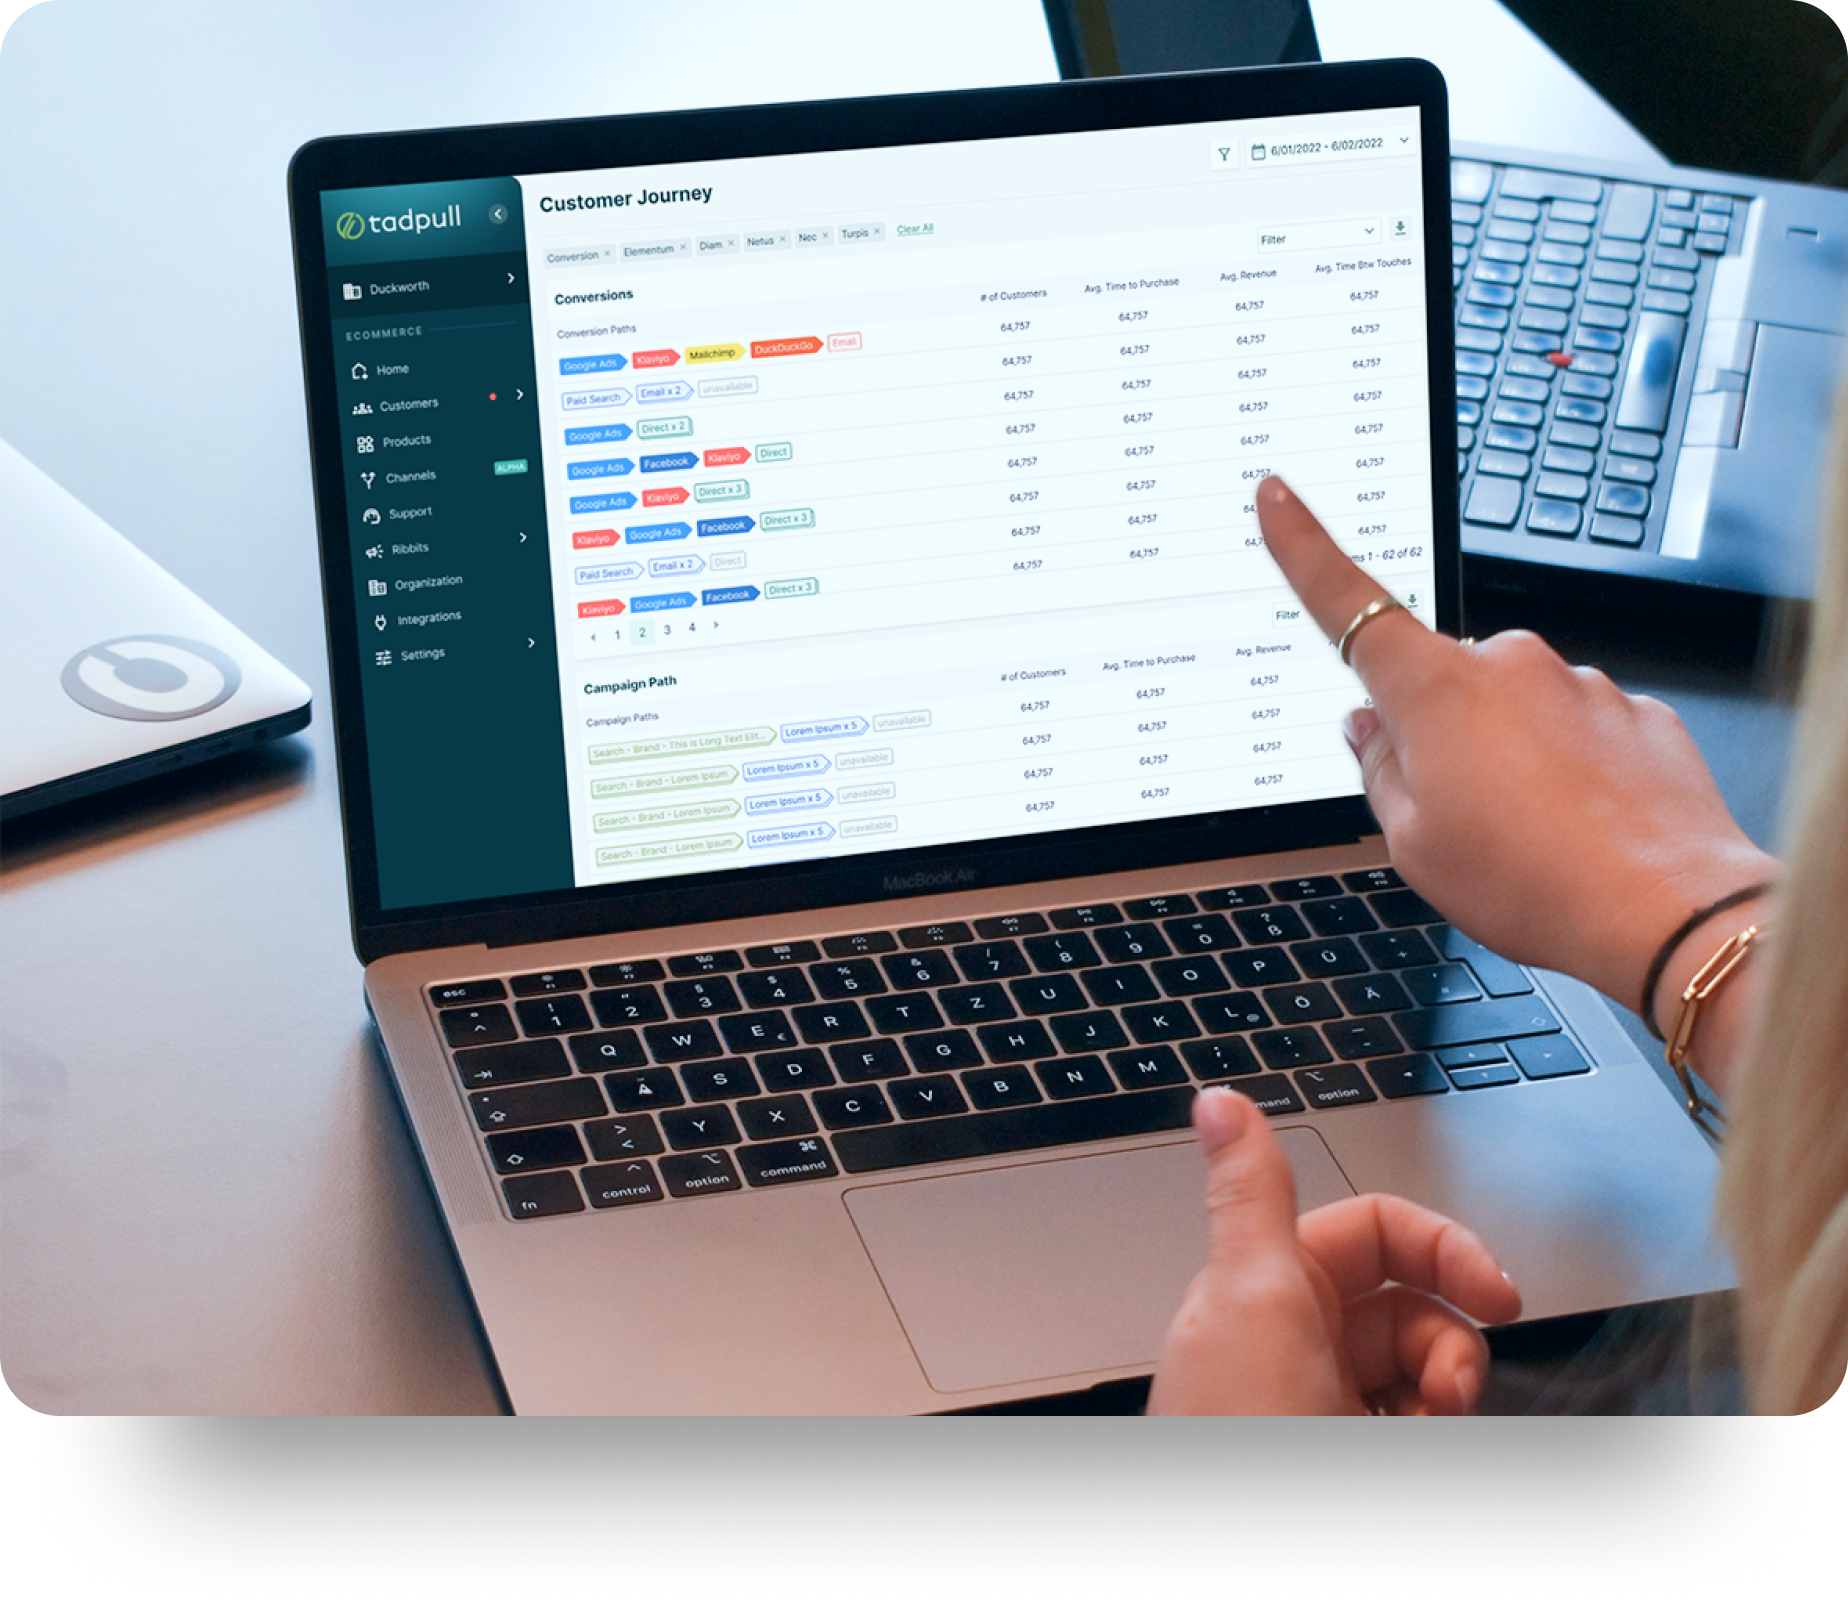
Your customers expect personalized online experiences. Using our proprietary software we meticulously segment audiences to attract more first-time customers and retain valuable existing customers.
More Confidence
We do the data-alignment heavy lifting, so you can reliably predict monthly and quarterly sales, understand profitability against acquisition costs, and have the agility to sell overstocked products without closeout pricing to the right customer.
We Partner With Clients To Help Them Succeed

Proactive campaign monitoring and optimization.

Weekly, data-based strategy recommendations to drive new growth opportunities.

Quarterly and annual strategy sessions, with recommendations based on Pond-powered insights.

24/7 access to customer, catalog and campaign data.
Proprietary tracker that collects reliable first-party data that’s yours for longer.

Constant testing means we find what works, then improve on it continuously.

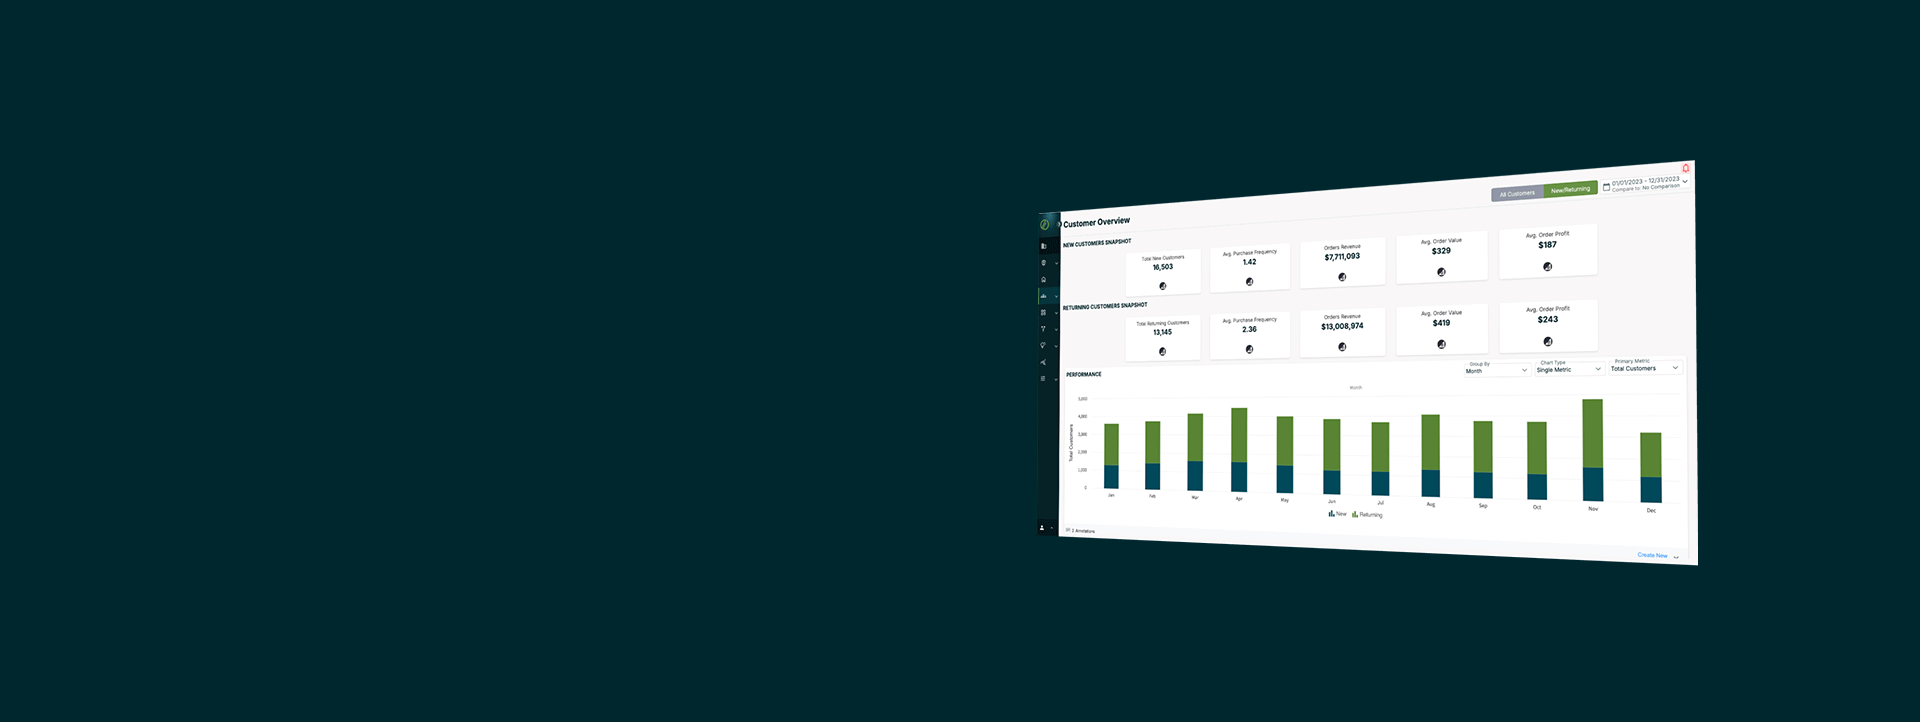
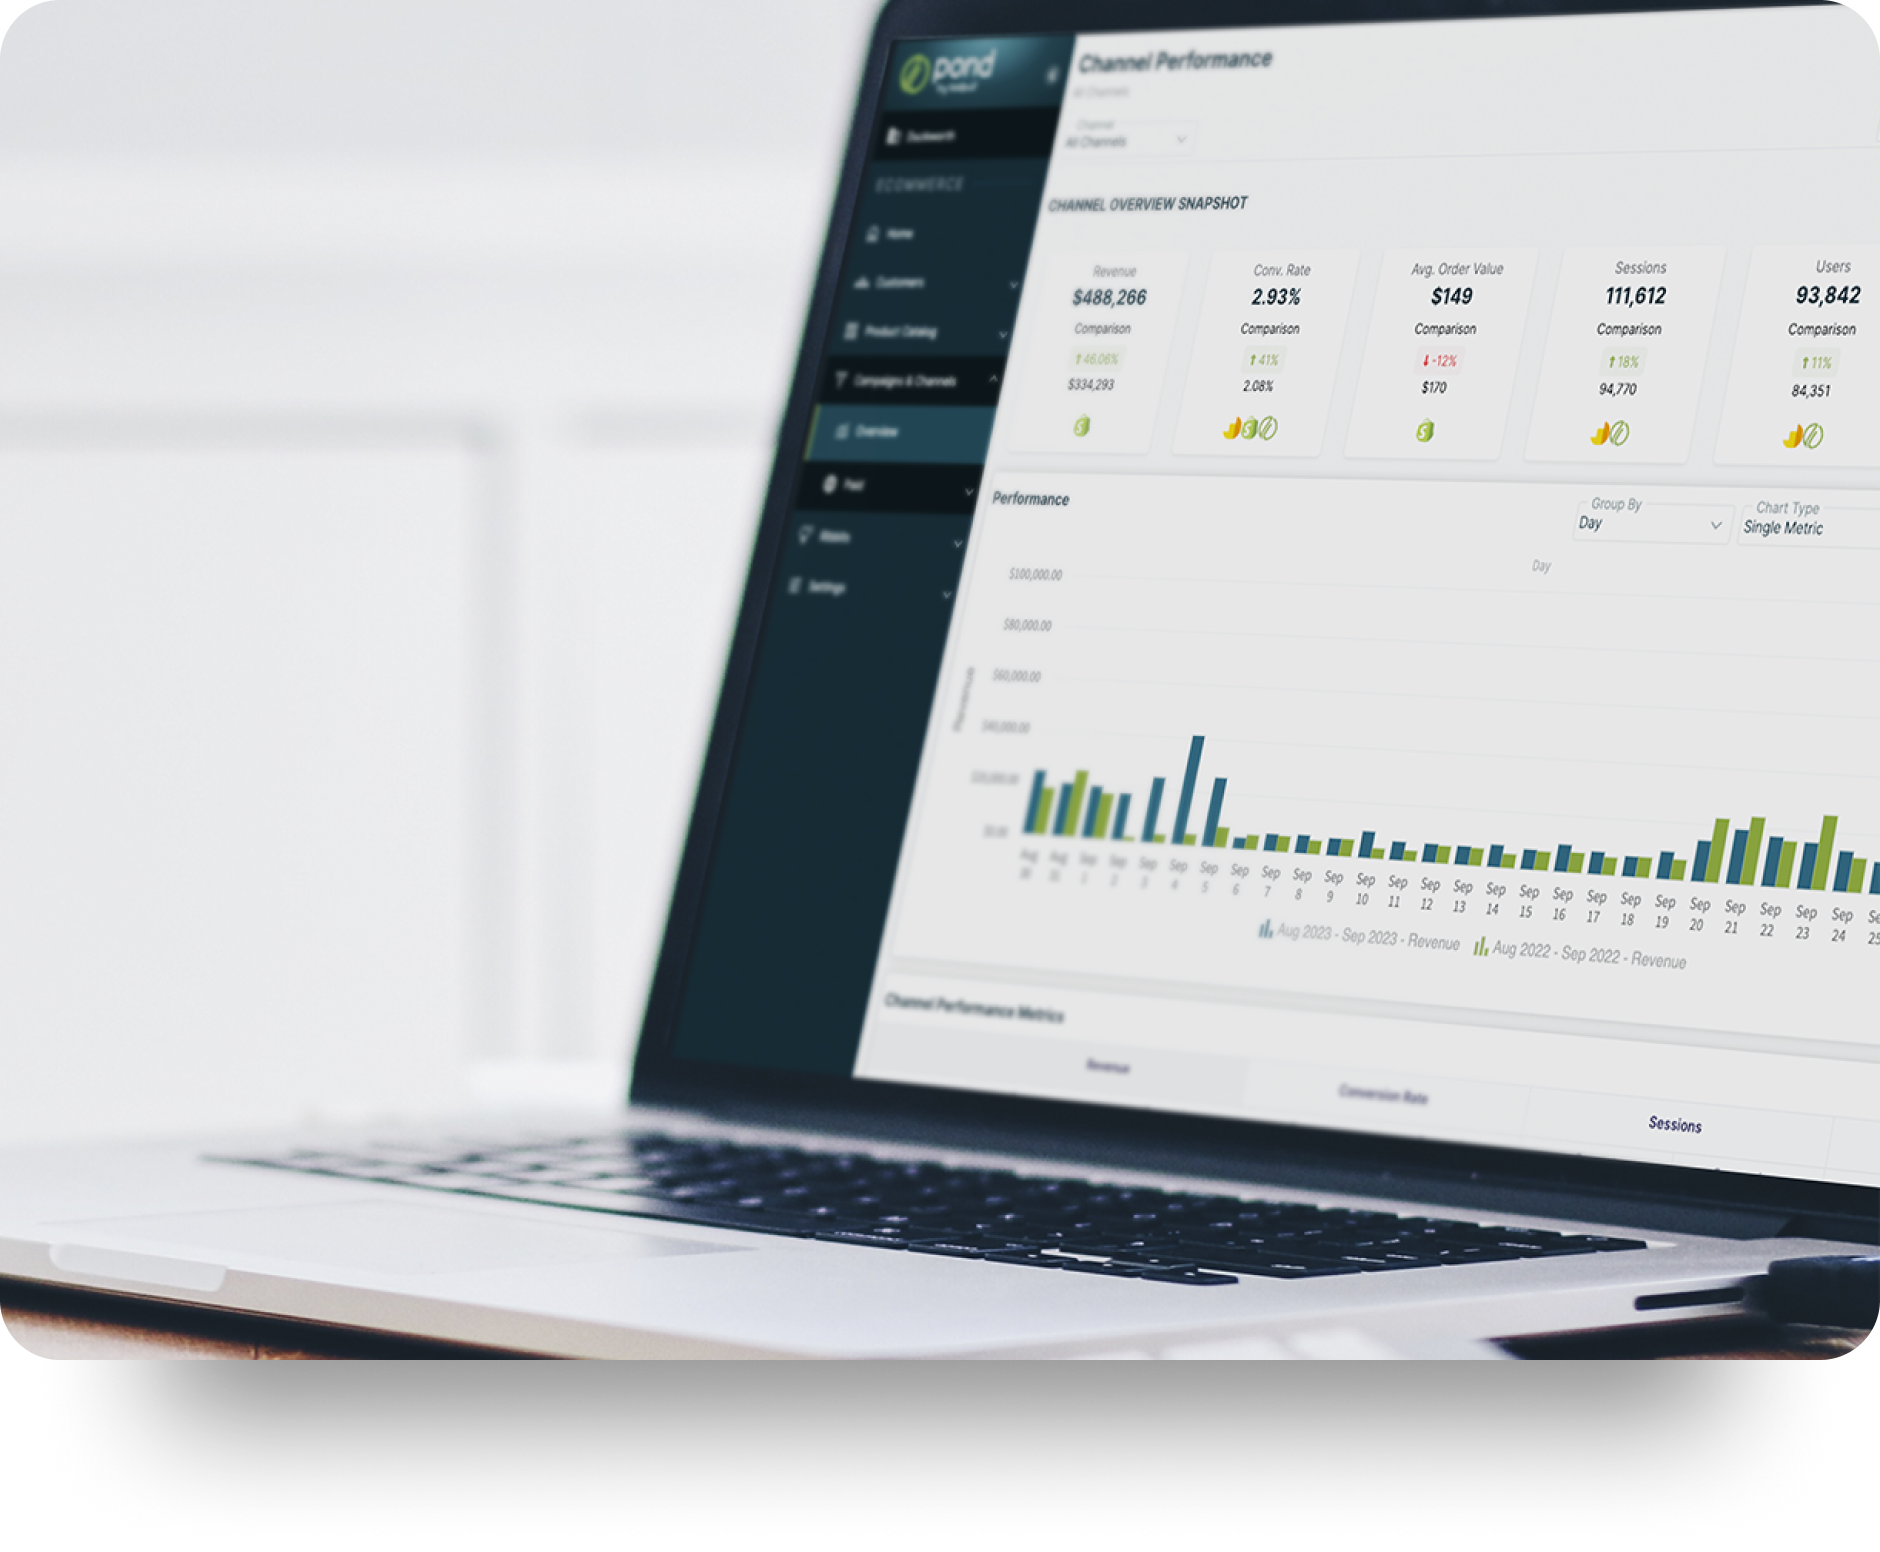
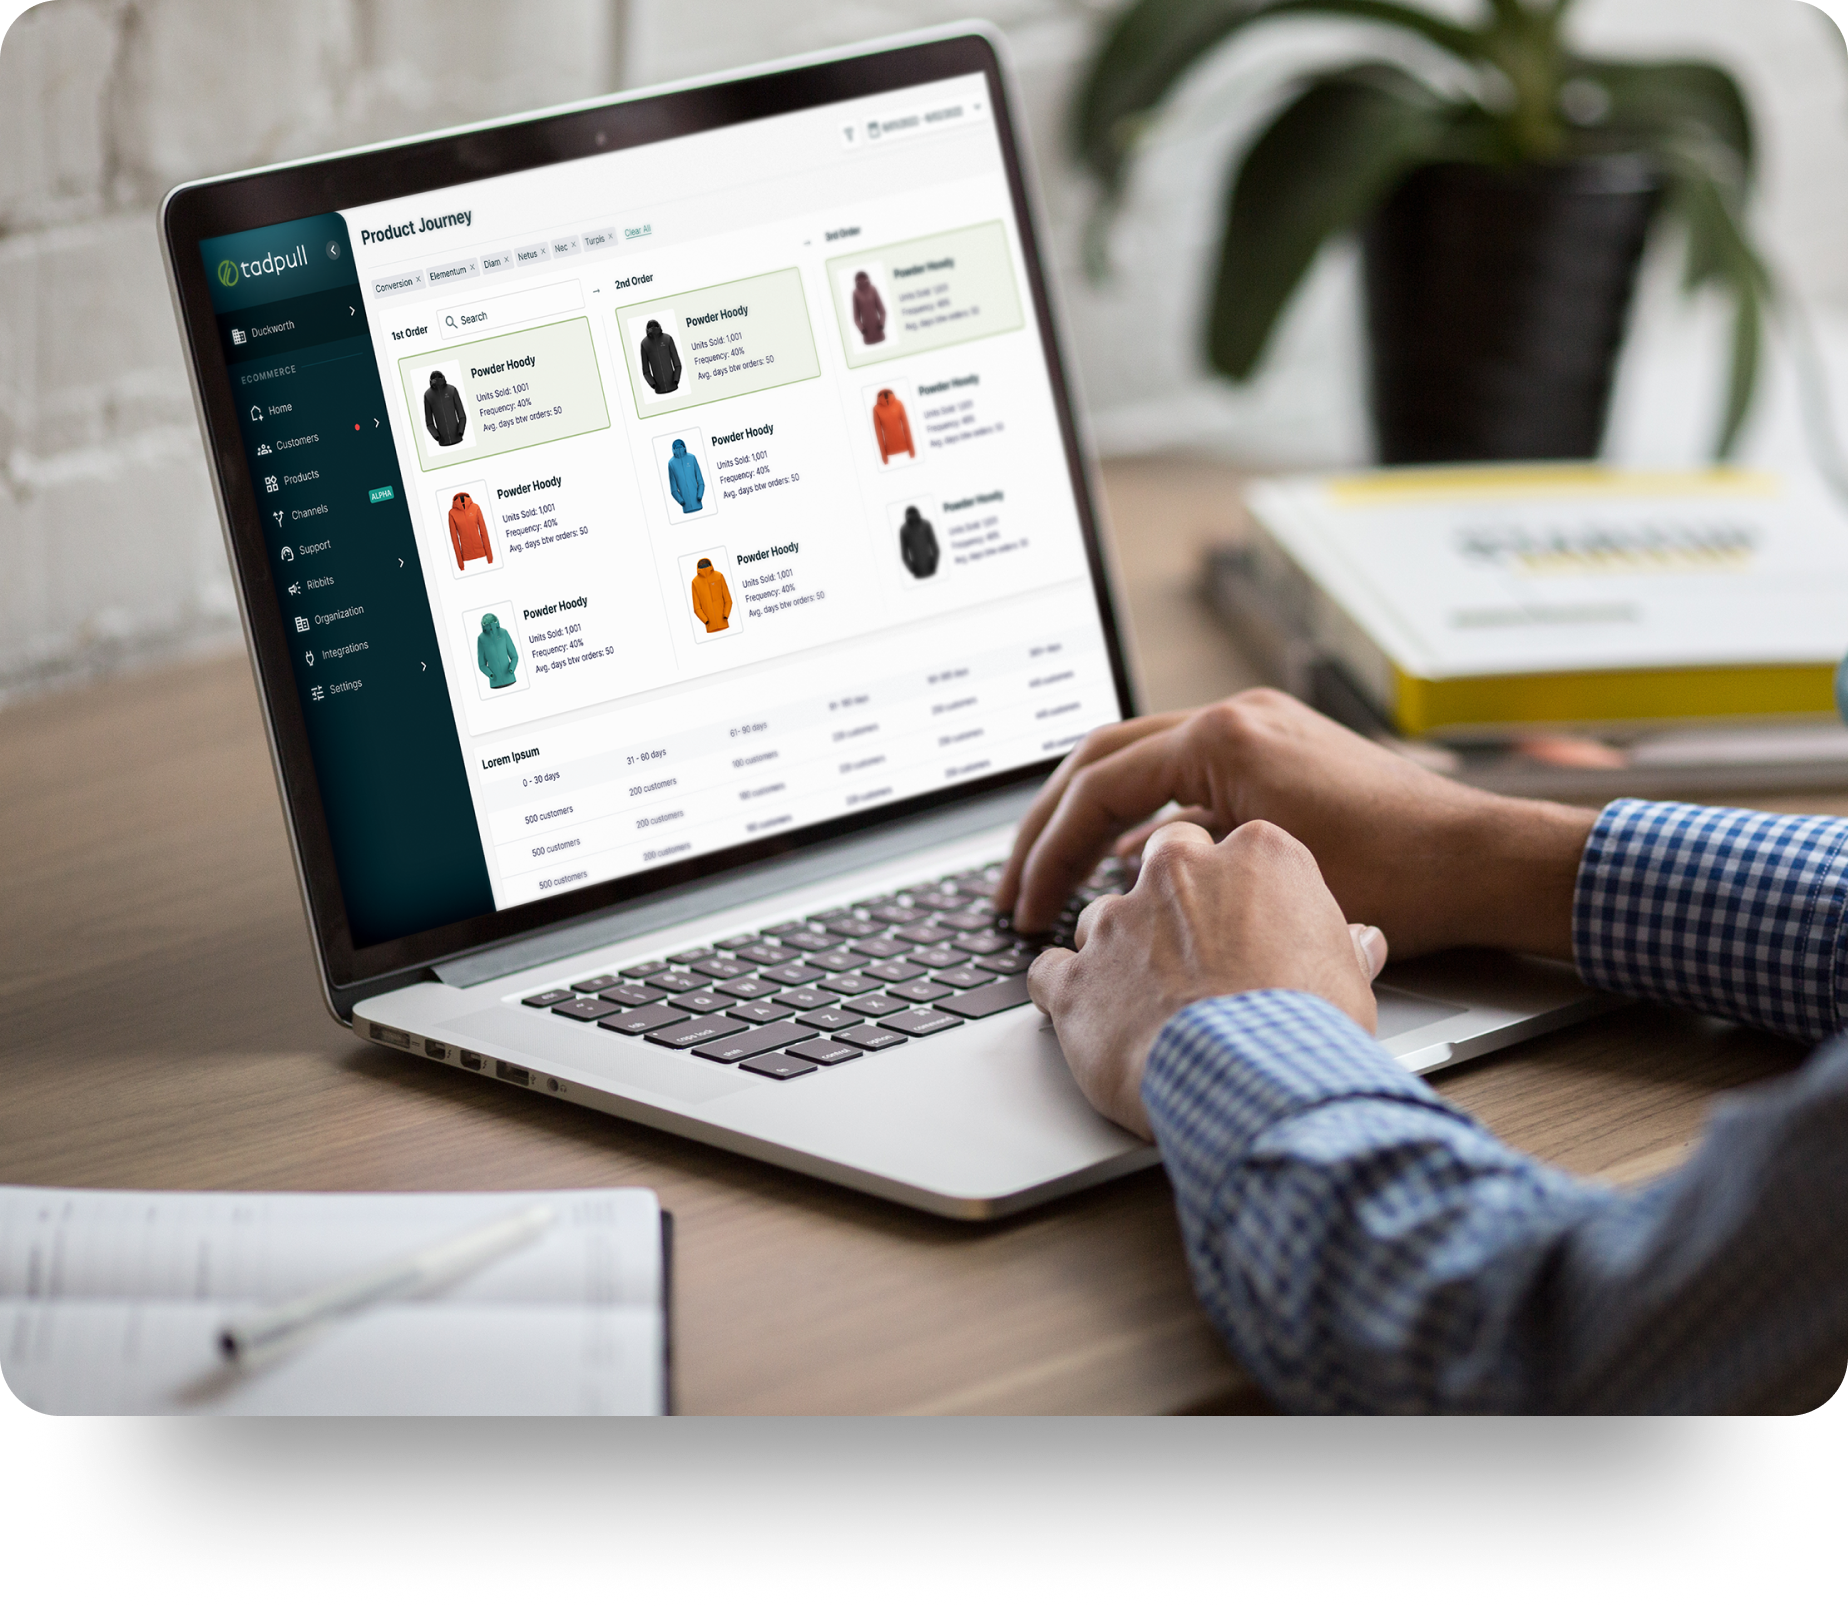
Data at the Center of What We Do
Our data scientists have identified three data sources as foundational to ecommerce success: customer, catalog, and digital marketingcampaign data.
Ecommerce Data Pond unifies these three data sources, enabling our marketing services team to make clear, agile decisions that will help your business thrive and grow.
Here’s How We’ve Helped Other Ecommerce Brands

76% increase in ecommerce revenue during a four-year span

21% increase in average order value

123% increase in conversion rate with $0 in ad spend
Ready to Get Started?
Book a Ecommerce Growth Consultation
Schedule your free 30-minute, no-obligation call with a Growth Expert to discover how we can help you increase your revenue and profitability.